App Developer Studio
July 2026Engineering Analytics

Weaver

The Engineering Intelligence Platform We Built to See Our Own Delivery Clearly

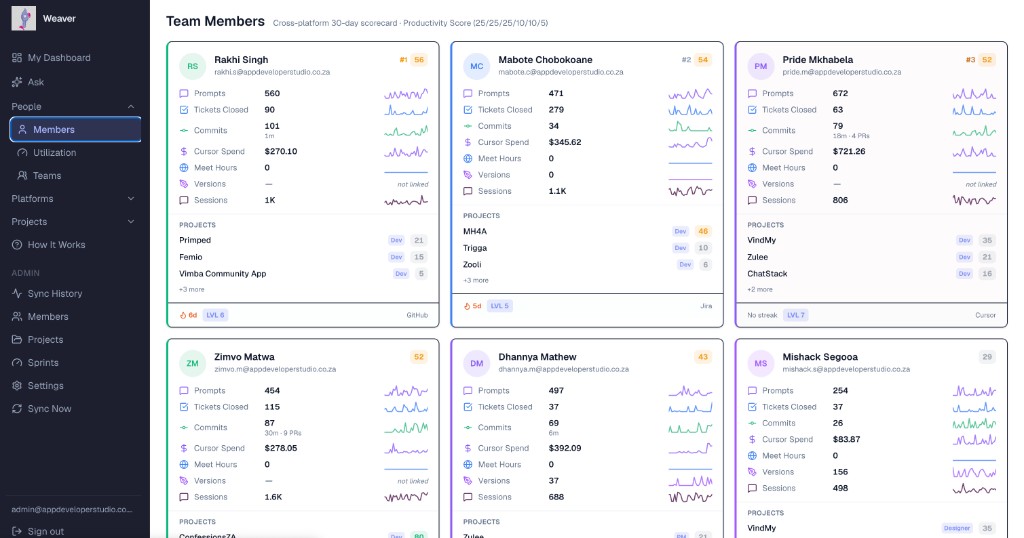
Weaver's team member scorecards, showing productivity scores and per-platform activity across a delivery team

Written by

Amanda Kaburise

Subject

Engineering Analytics

Published on

July 2026

Background

We run projects across six tools — Cursor, Jira, GitHub, Google Workspace, Figma, and Slack — each holding one slice of the truth about how a project, or a person, is actually doing. Getting a straight answer to “how is the team doing?” meant manually cross-referencing all six, usually after a deadline had already slipped. We built Weaver to remove that manual step, for ourselves first.
Problem Statement

Sprint velocity and ticket quality lived in Jira. Code activity lived in GitHub. AI tool usage and spend lived in a separate admin console. Design progress lived in Figma. Meeting load and communication patterns lived in Google Workspace and Slack. None of it talked to each other, so status updates were built by hand, and risk — an overloaded developer, a stalled branch, a quality regression — usually surfaced in a meeting, not before one.

Solution

Weaver syncs all six sources into one database every night, on demand, and via historical backfill, then computes the same metrics the same way for everyone. It presents them through gamified leaderboards, per-member scorecards, and project health dashboards. A built-in AI assistant answers plain-language questions about the data directly, and an automated risk-alerting engine flags problems before they become delivery issues.

See it in action

A Live View of Team and Project Health

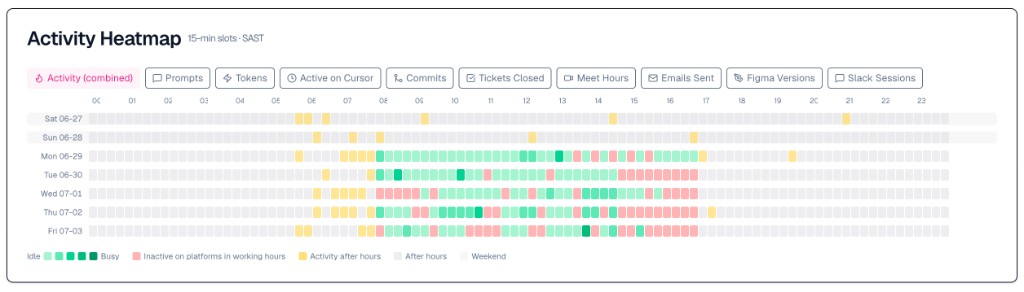
Weaver's 15-minute-resolution activity heatmap, showing busy, idle, and after-hours activity across a week
A 15-minute-resolution heatmap blends AI usage, commits, ticket completions, and meetings into one view — idle versus busy is obvious at a glance, in or out of business hours.
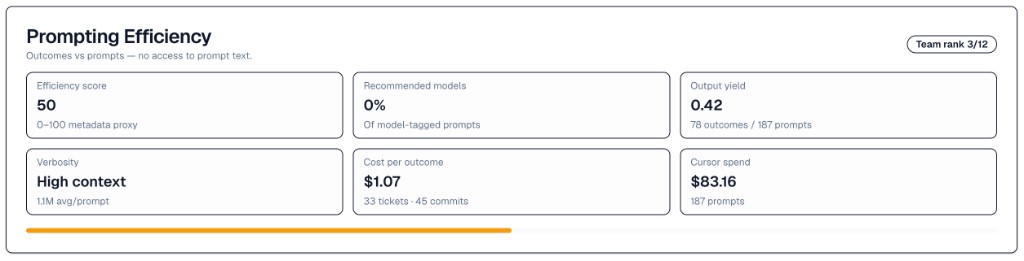
Weaver's prompting efficiency panel, showing efficiency score, output yield, and cost per outcome
Metrics stay explainable, not a black box — efficiency score, output yield, and cost per outcome are all shown with their inputs, not just a single number.

Under the hood

Key Features

01

Team Member Scorecards

Every team member gets a live, explainable Productivity Score (0–100), combining AI-assisted coding, ticket delivery, commit activity, meetings, and design output into one number — every input stays visible on the member's own detail page.

02

Per-Member Deep Dive

A 15-minute-resolution activity heatmap blending AI usage, commits, tickets, and meetings, a combined Jira + GitHub delivery timeline, estimated AI tool spend by project, and gamified achievement badges.

03

Platform Leaderboards

Dedicated, time-windowed leaderboards for Cursor, Jira, GitHub, Google, Figma, and Slack, so leads can drill into any one tool's usage across the whole team.

04

Project Health Scorecards

A composite health score per project, blending delivery, code activity, AI spend, and design progress into a single number PMs can track over time, with a full drill-down per project.

05

Automated Risk & Anomaly Alerts

A rules engine flags over- and under-utilization against sprint capacity, stale branches, missing commits against active sprint work, ticket pileups, and quality regressions — automatically, on a schedule.

06

“Ask”: an AI Assistant Built Into the Dashboard

Plain-English questions — “who completed the most tickets last month?” — get answered live from the underlying data, with the source tools shown for full transparency.

07

Weekly Slack Digest

A private, personalised weekly message delivered straight to each team member's Slack: their own KPIs against trend, plus any personal risk flags — over-utilization, a stale branch, unusual AI spend — with a link back to their dashboard for detail. Team leads keep the aggregate view; everyone else gets their own numbers, not a public leaderboard callout.

Data sources

Platforms Weaver Unifies

Every platform syncs on its own schedule, independently — new data sources can be added without touching existing dashboards or historical data.

What we had to solve

Challenges and Solutions

Fair, explainable scoring

A single productivity number is only useful if people trust it. We solved it by making every score fully explainable — every input that produced it is visible on the member's own detail page, not hidden behind a formula.

Visibility without surveillance

Automated alerts can easily read as a surveillance tool instead of a support one. We solved it by keeping personal risk flags private and per-person by default — team leads keep the aggregate view they already had, not a new way to watch individuals.

What happened

Outcome

We use Weaver on ourselves — the screenshots above are our own team and our own projects, not a demo dataset. Once other engineering leads saw what it did for our own delivery visibility, we opened it up so their teams could use it too.

6 tools
unified into one nightly sync — no more manual status assembly
0–100
explainable productivity score, every input visible on request
Weekly
personalised Slack digest, shipped and DM'd to every member

Future Directions

We’re extending sync coverage — Slack’s message and huddle analytics are ready to enable on a plan upgrade — and building the same automated-alerting logic into project-level Slack channels, not just personal DMs.

Conclusion

Weaver is the same discipline behind ChatStack, aimed at a different bottleneck: we couldn’t see our own delivery clearly, so we built the tool that shows it to us, and used it on ourselves first. Now other engineering teams and agencies who want the same visibility can use it too. Explore our AI Solutions and Enterprise AI Consulting services to see how we apply the same approach for clients.

Want this for your team?

See Your Own Engineering Delivery This Clearly

Weaver started as a tool to fix our own blind spots. If your team is flying blind across Cursor, Jira, GitHub, Figma, Slack, and Google Workspace, talk to us about building the same thing for you.

Get a Free Quote